
We are so excited to bring about a major release for the ColdBox Debugger project: v3.0.0. However, what in the world is the ColdBox Debugger module? I am glad you asked:
What is the ColdBox Debugger?
The ColdBox Debugger module is a lightweight performance monitor and profiling tool for ColdBox applications. It can generate a nice debugging panel on every rendered page or a dedicated visualizer to make your ColdBox application development nicer, funner and greater! Yes, funner is a word!
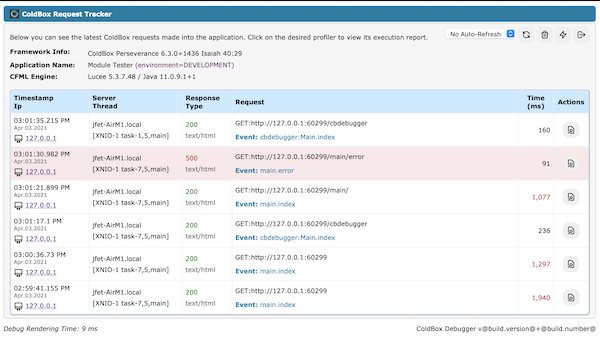
Debugger Request Visualizer
Request Tracker Collapsed
Capabilities
The ColdBox debugger is a lightweight performance monitor and profiler for your ColdBox applications. It tracks your requests, whether Ajax, traditional or REST, it's environment, execution and much more. Here is a listing of some of the capabilities you get with the ColdBox Debugger:
- Track all incoming requests to your applications in memory or offloaded cache
- Track exceptions and execution environment
- Track incoming http requests, parameters, body and much more
- Track final request collections
- Track Hibernate and
cbormqueries, criteria queries and session stats - Track
qbandquickqueries, entities and stats - Tap into LogBox via our Tracer messages and discover logging on a per request basis
- Profile execution and results of ANY model object
- Profile execution of ANY ColdBox interception point
- Custom Timer helpers for adding timing methods and annotations anywhere in our code
- Profile your production or development apps with ease
- Track ColdBox modules and lifecycles
- Highly configurable
- Highly extensible
Installation
It's very easy. Just use CommandBox:
1 |
install cbdebugger |
By default, the debugger will track major ColdBox components. However, we encourage you to tweak your configuration for maximum tracking capabilities and customizations.
Settings
The Debugger is highly configurable and can tap into third party modules to activate new tracking panels. Here are the major configuration options available to you. Open your config/coldbox.cfc configuration object and add into the moduleSettings the cbDebugger key with the following options:
1 2 3 4 5 6 7 8 9 10 11 12 13 14 15 16 17 18 19 20 21 22 23 24 25 26 27 28 29 30 31 32 33 34 35 36 37 38 39 40 41 42 43 44 45 46 47 48 49 50 51 52 53 54 55 56 57 58 59 60 61 62 63 64 65 66 67 68 69 70 71 72 73 74 75 76 77 78 79 80 81 82 83 84 85 86 |
moduleSettings = { // Debugger Settings cbDebugger = { // Master switch to enable/disable request tracking into storage facilities. enabled : true, // Turn the debugger UI on/off by default. You can always enable it via the URL using your debug password // Please note that this is not the same as the master switch above // The debug mode can be false and the debugger will still collect request tracking debugMode : true, // The URL password to use to activate it on demand debugPassword : "cb:null", // Request Tracker Options requestTracker : { // Store the request profilers in heap memory or in cachebox, default is cachebox storage : "cachebox", // Which cache region to store the profilers in cacheName : "template", // Expand by default the tracker panel or not expanded : true, // Slow request threshold in milliseconds, if execution time is above it, we mark those transactions as red slowExecutionThreshold : 1000, // How many tracking profilers to keep in stack: Default is to monitor the last 20 requests maxProfilers : 50, // If enabled, the debugger will monitor the creation time of CFC objects via WireBox profileWireBoxObjectCreation : false, // Profile model objects annotated with the `profile` annotation profileObjects : false, // If enabled, will trace the results of any methods that are being profiled traceObjectResults : false, // Profile Custom or Core interception points profileInterceptions : false, // By default all interception events are excluded, you must include what you want to profile includedInterceptions : [], // Control the execution timers executionTimers : { expanded : true, // Slow transaction timers in milliseconds, if execution time of the timer is above it, we mark it slowTimerThreshold : 250 }, // Control the coldbox info reporting coldboxInfo : { expanded : false }, // Control the http request reporting httpRequest : { expanded : false, // If enabled, we will profile HTTP Body content, disabled by default as it contains lots of data profileHTTPBody : false } }, // ColdBox Tracer Appender Messages tracers : { enabled : true, expanded : false }, // Request Collections Reporting collections : { // Enable tracking enabled : false, // Expanded panel or not expanded : false, // How many rows to dump for object collections maxQueryRows : 50, // Max number to use when dumping objects via the top argument maxDumpTop: 5 }, // CacheBox Reporting cachebox : { enabled : false, expanded : false }, // Modules Reporting modules : { enabled : false, expanded : false }, // Quick and QB Reporting qb : { enabled : true, expanded : false, // Log the binding parameters logParams : true }, // cborm Reporting cborm : { enabled : true, expanded : false, // Log the binding parameters logParams : true }, // Async Manager Reporting async : { enabled : true, expanded : false } }} |
Hibernate/cborm + qb/Quick Tracking
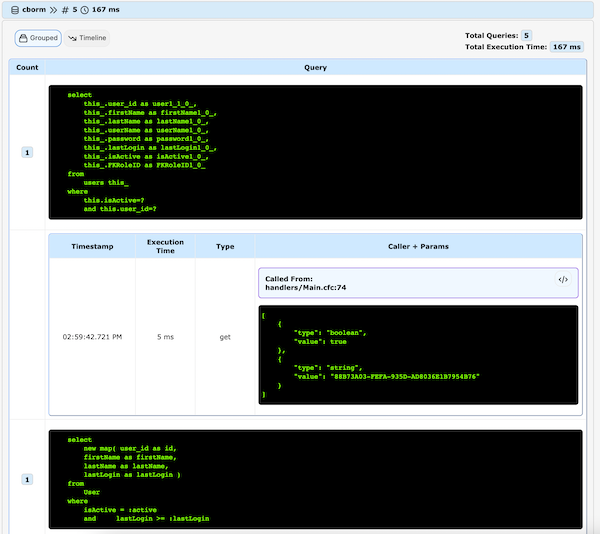
Grouped cborm calls
We have a dedicated panel in the debugger that will track all criteria queries, executeQuery(), qb and quick orm calls from within your application. It will show you a grouped or a timeline visualizer of all these sql calls. You can even see the executable sql, binding parameters and time metrics. You can also copy the sql or even go to the line of code that made the execution of the call.
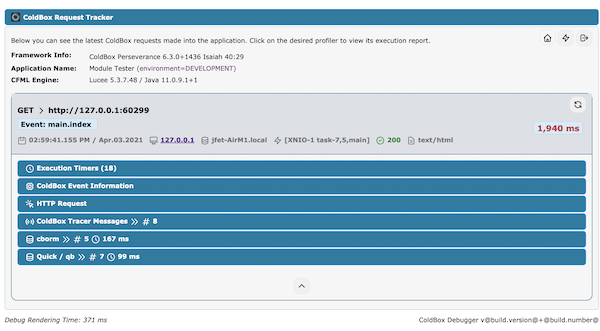
Debugger Visualizer
Debugger Visualizer
A part from debugging the incoming request and presenting the debugger at the end of the request, you can also navigate to /cbdebugger and visualize the Debugger request tracker. This panel will monitor ALL incoming requests to your application: rest, soap, ajax, etc.
You can execute several commands from this visualizer:
- Clear all request history
- Reinit ColdBox
- Shutdown the debugger visualizer
- Refresh the requests
- Auto refresh the requests
You can then select a specific request and open the request report with all the tracked information.
Further Instructions
You can visit our documentation here: https://github.com/coldbox-modules/cbdebugger to see all the capabilities you can get with the ColdBox Debugger.
Future Development
We are also laying the foundation for the ColdBox Debugger Desktop application that you will use to monitor and track your production or any application. Feedback is highly encouraged!

Add Your Comment